On-chain Data Academy (Part 1): Do you know what the average market-wide BTC cost is?

Original Article Title: "On-Chain Data School (Part 1): Do You Know What the Market-Wide BTC Average Cost Is?"
Original Article Author: Mr. Berg, On-Chain Data Analyst
TLDR
· This article will introduce "one on-chain analysis concept" and "three on-chain data points"
· MVRV represents the market-wide profit state
· Realized Price represents the average cost of holding BTC for the entire market
· Realized Cap can be thought of as "how much money the market collectively spent to buy BTC"
What Is Realized Cap?
Realized Cap, also known as Realized Market Cap, refers to "multiplying each unit of BTC by the price at the last transfer, and then summing them up".
In simple terms: Each transfer can be seen as a "transaction", so multiplying the corresponding amount of BTC by the price at the last transfer is equivalent to the cost of that transaction. Adding up these costs gives you the Realized Cap.
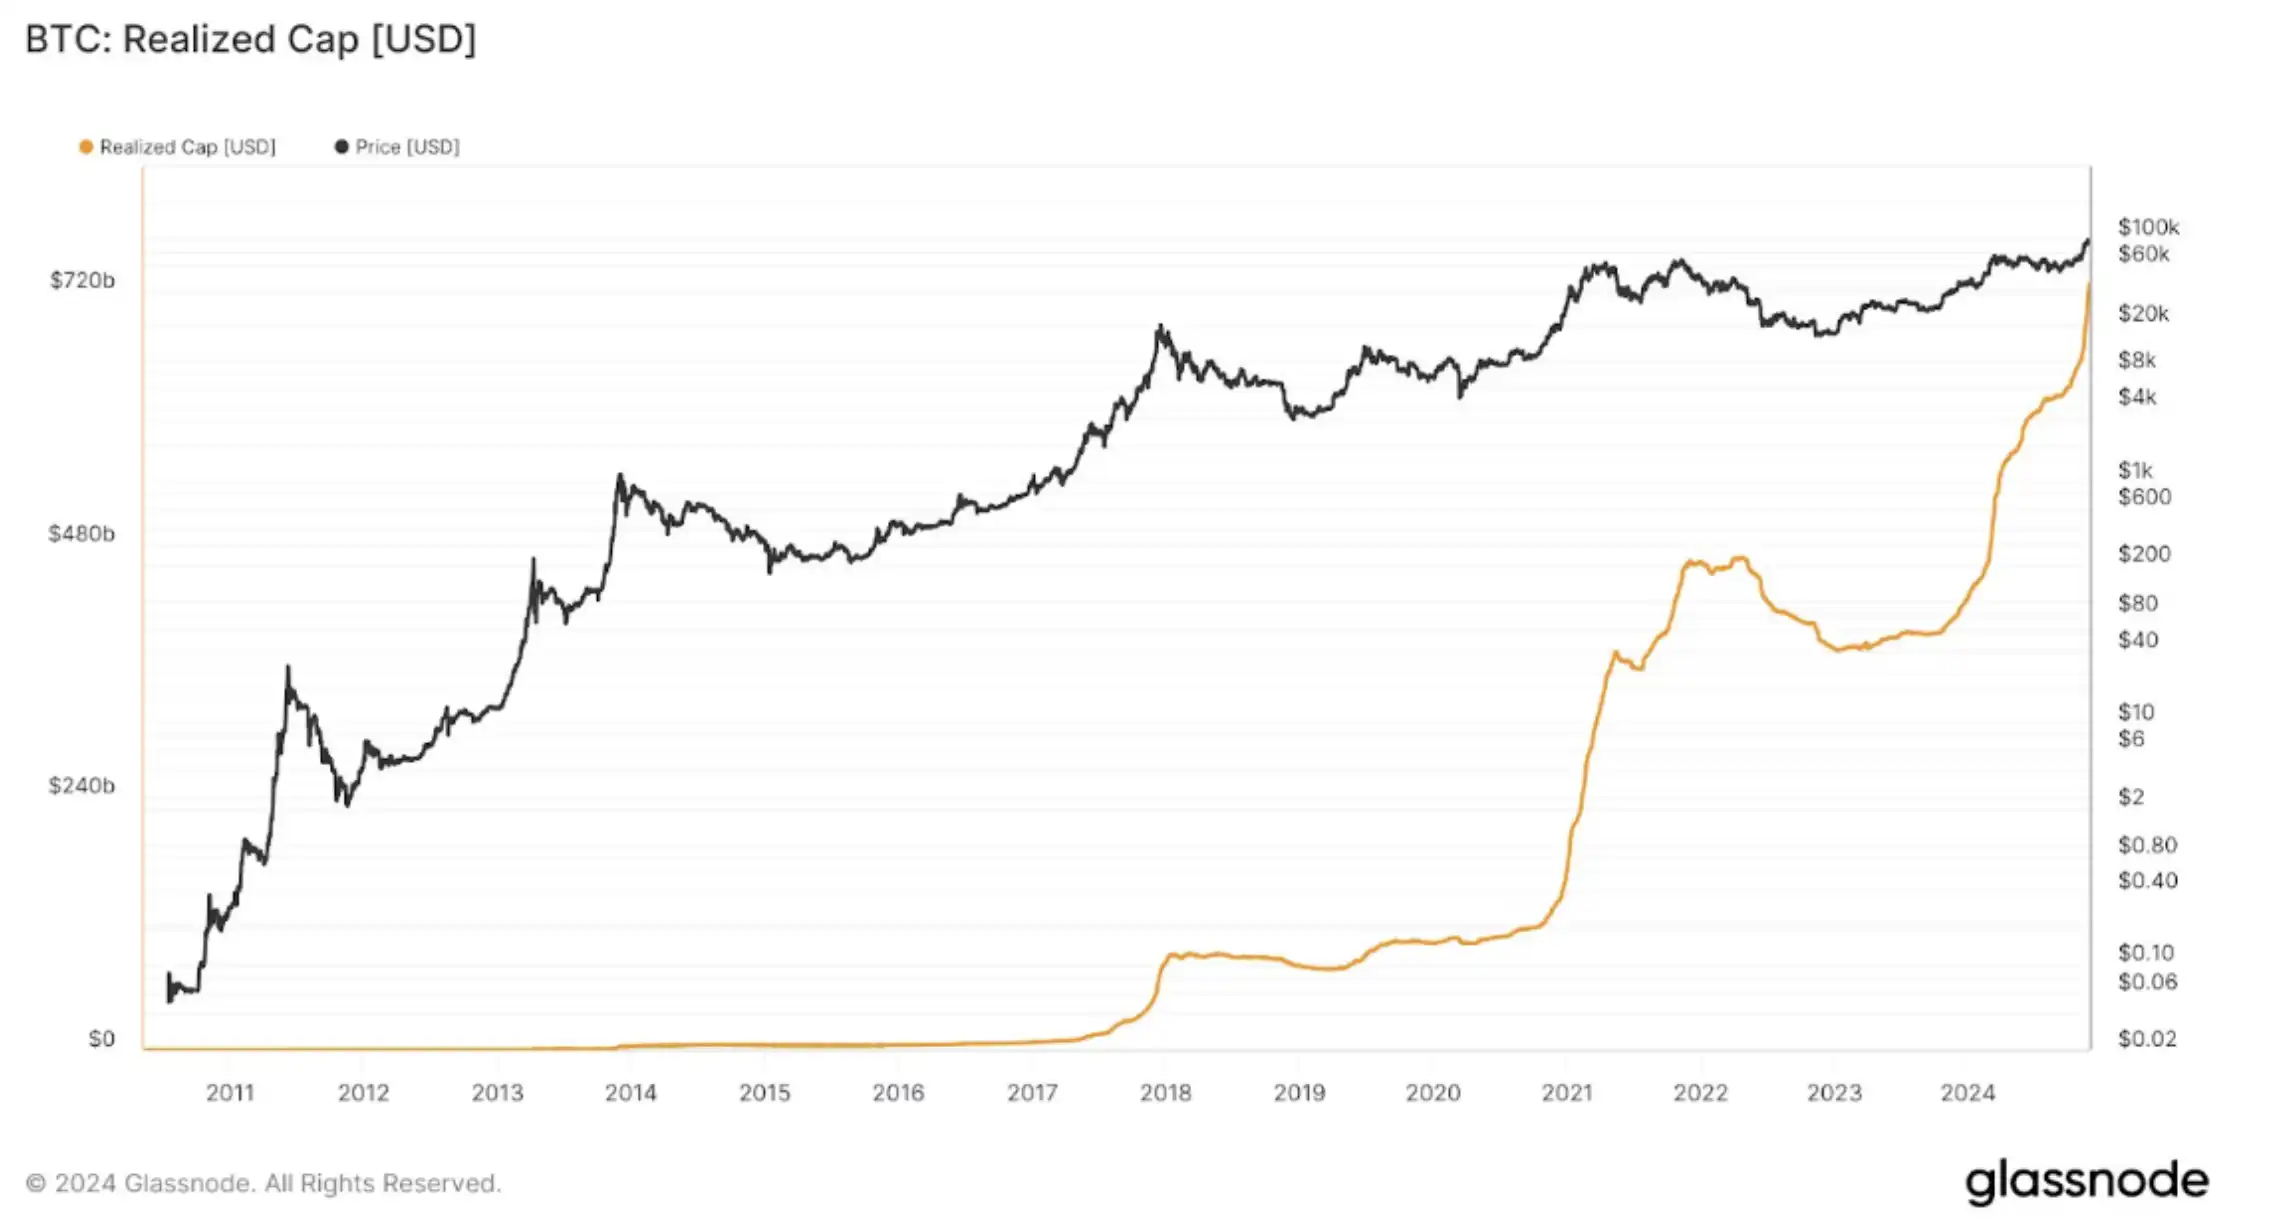
Realized Cap Chart
What Is Realized Price?
Realized Price (RP), also known as Realized Price, is the number obtained by dividing "Realized Cap by the current BTC circulating supply".
We can interpret this as: "Total cost of BTC purchased by the whole market / How many BTC were purchased".
In other words, this is the "average cost of BTC for the entire market". By the way, it's always a good buying opportunity when the price is below RP!

Realized Price Chart

(Price Below Realized Price)
What Is MVRV?
MVRV, short for MV divided by RV, represents the market's profitability status.
MV refers to the current BTC market value, i.e., "market price x circulating supply"; while RV is Realized Cap.
Moreover, if both the numerator and denominator of the formula are divided by the circulating supply, MVRV can also be expressed as "market price / RP." For example: if MVRV = 2, it represents an average market profitability of 100%.

MVRV Chart
Summary
The above is all the content of On-Chain Data School (Part One). For readers interested in delving deeper into on-chain data analysis, remember to track this series of articles!
If you want to see more analysis and educational content on on-chain data, feel free to follow my Twitter (X) account!
Hope this article has been helpful to you. Thank you for reading.
You may also like

Rented Belief: How Much of the Bitcoin ETF Fund Flow is Real Money

The two giants are racing in "credit": loan balances of 9.9 billion vs 14.6 billion USD, Brazil has become the main battlefield

A company that was on the verge of bankruptcy has just surpassed Bitcoin in market value

B.AI partners with MiniMax to launch a limited-time free experience of M3, enabling zero-threshold implementation of Agentic productivity through full-stack infrastructure

The second half of the computing power battle: Intel CEO Pat Gelsinger reveals how AI is reshaping the global semiconductor supply chain

WEEX Live mode: Monitor 20 trading pairs at once and trade like a pro

Morning Report | Secret Network loses $4.67 million due to cross-chain vulnerability; Michael Saylor releases Bitcoin Tracker information again, may disclose increased holdings data next week

Kalshi's biggest competitor is not Polymarket
WEEX Makes Affiliate Access Easier on the Web and in the App
Customize Your Spot Trading Page: Drag Modules and Move the Order Panel Where You Want It

Perp DEX: The Next Generation Exchange "War"

10 Counterintuitive Insights on Latin American Payments

The AI gamble of mining companies: Valuations enter a phase of differentiation, and it's hard to turn the tide
A letter from Alliance to entrepreneurs: Written on the occasion of Cursor selling for 60 billion dollars
Stablecoins Finally Find Real Returns: On-Chain Reinsurance Re Explained | Interview with Re Founder Karan Saroya

The impossible triangle is simply a pseudo problem

Will MicroStrategy fall into a death spiral? What will the macro trend be in the second half of the year?

