- Buy Crypto
- Markets
 Futures
- Spot
- Copy Trade
- Earn
- More
Breaking Down the Top 5 Metrics Defining BTC's Real Make-or-Break Level – Is $75K the Bottom?
Original Article Title: "5 Key Data Metrics Revealed: Is There a BTC Buying Opportunity Below $75,000?"
Original Article Author: Mach, Foresight News
Wintermute stated last week that $85,000 was a crucial level for BTC and would choose a direction soon, unfortunately, that direction was not upward but a significant move to the downside.
On February 2nd, BTC briefly dipped to $75,700, ETH to $2,220, while many altcoins remained in a downtrend. In terms of liquidation data, according to Coinglass data, liquidations totaled $435 million in the last 12 hours, with longs liquidated at $324 million.
The market fear index is at 15, with market sentiment once again entering extreme fear.
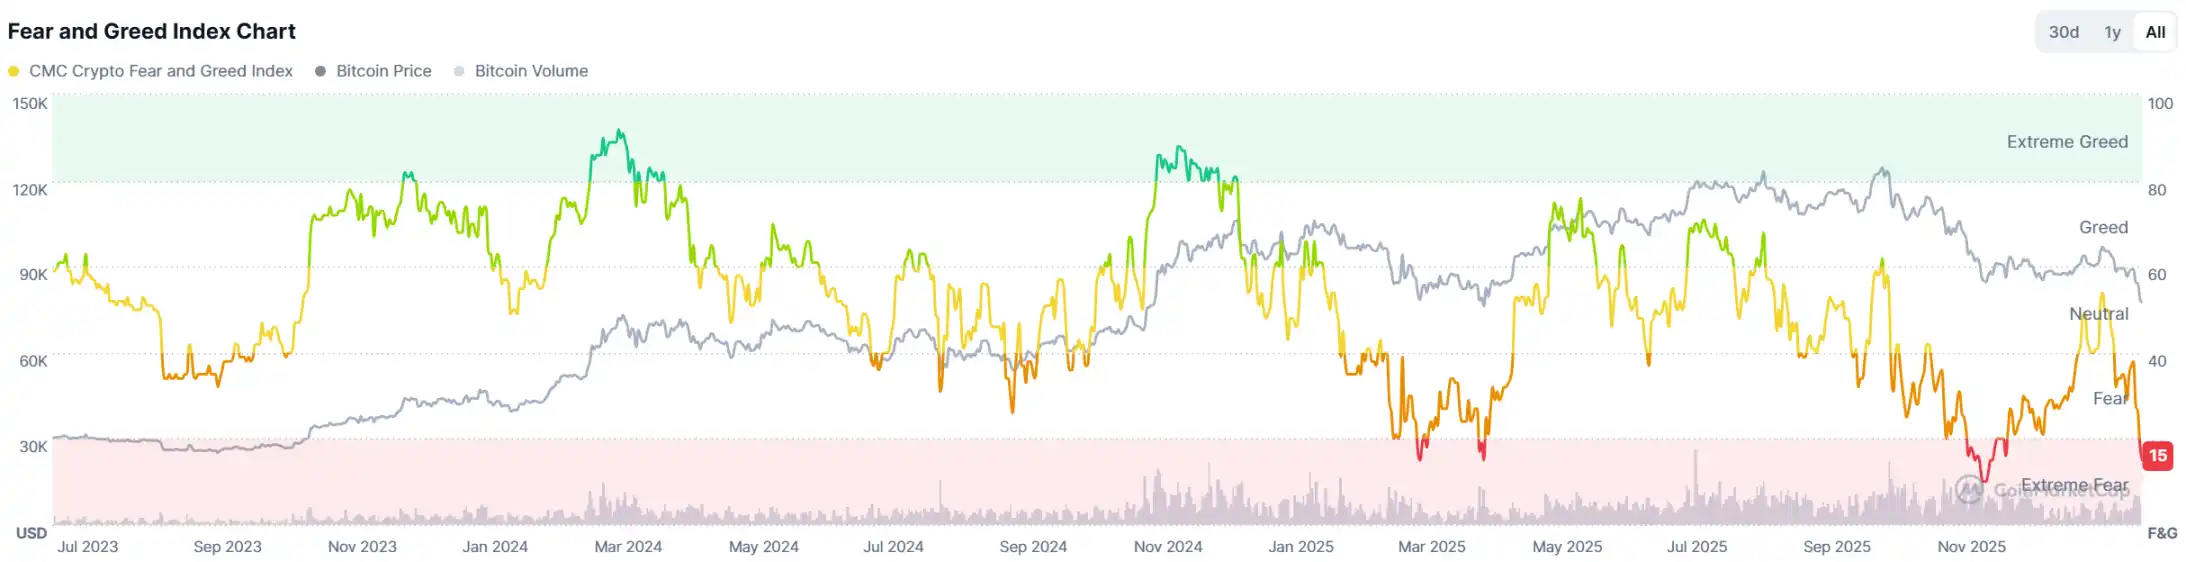
After the market turned bearish, where exactly is the bottom range for BTC? Let five key data metrics reveal it to you.
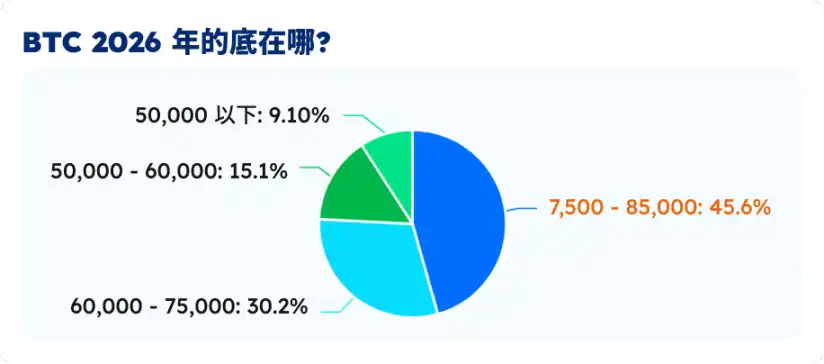
Data Survey: 30% of Users Believe BTC's Bottom Range Is Between $60,000 and $75,000
On January 30th, Foresight News conducted an investor market confidence survey. On that day, when the market survey was conducted, BTC's price was at $84,000. In the following days, it experienced a significant decline, so the survey results are for reference only.
The survey results (1189 votes) showed that the majority of respondents (45.6%) believed that BTC's bottom price in 2026 would be between $75,000 and $85,000. Another 30.2% of respondents believed the bottom price would be between $60,000 and $75,000.
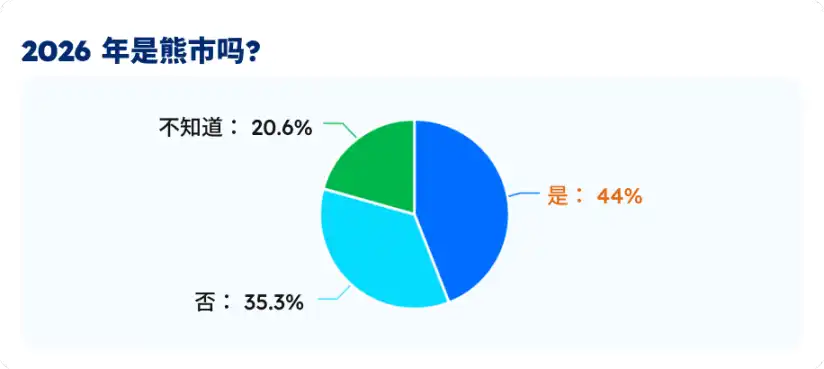
44% of respondents believed that 2026 would be a bear market, while 35.3% of respondents disagreed, thinking it would not be a bear market. Another 20.6% of respondents expressed uncertainty.
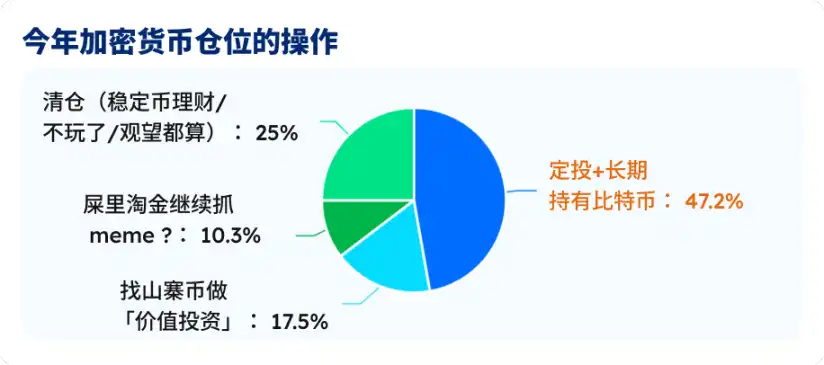
Nearly half of the respondents (47.2%) chose to dollar-cost average and hold Bitcoin long-term. Another 25% of respondents chose to cash out, switch to stablecoin investments, or wait and see the market. 17.5% of respondents looked for altcoins for value investment.
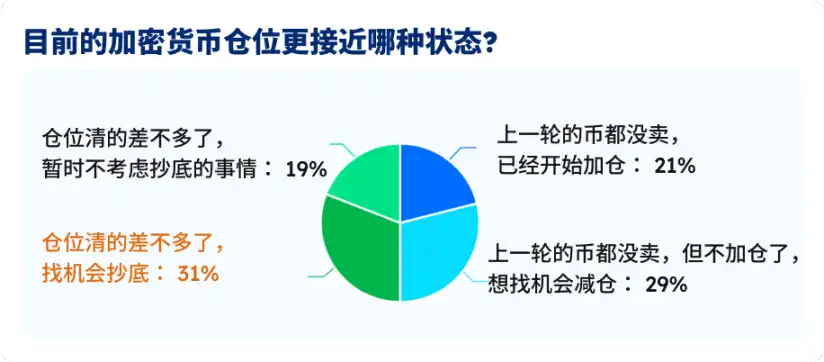
Among the current survey respondents, 31% stated that they had nearly cleared their positions but were still looking for opportunities to buy the dip. 29% of respondents said they hadn't sold any of their coins from the last cycle but were not adding to their position for now, waiting for an opportunity to sell. 21% of respondents said they hadn't sold any of their coins from the last cycle and had started to increase their positions.
Glassnode Shows BTC On-Chain Cost $55.9k
Bitcoin dropped below $78k, and Glassnode updated the Bitcoin on-chain key price distribution as follows: STH (Short-Term Holder) cost basis, reflecting the average holding price of recent months' new buyer/trader influx, is $95.4k.
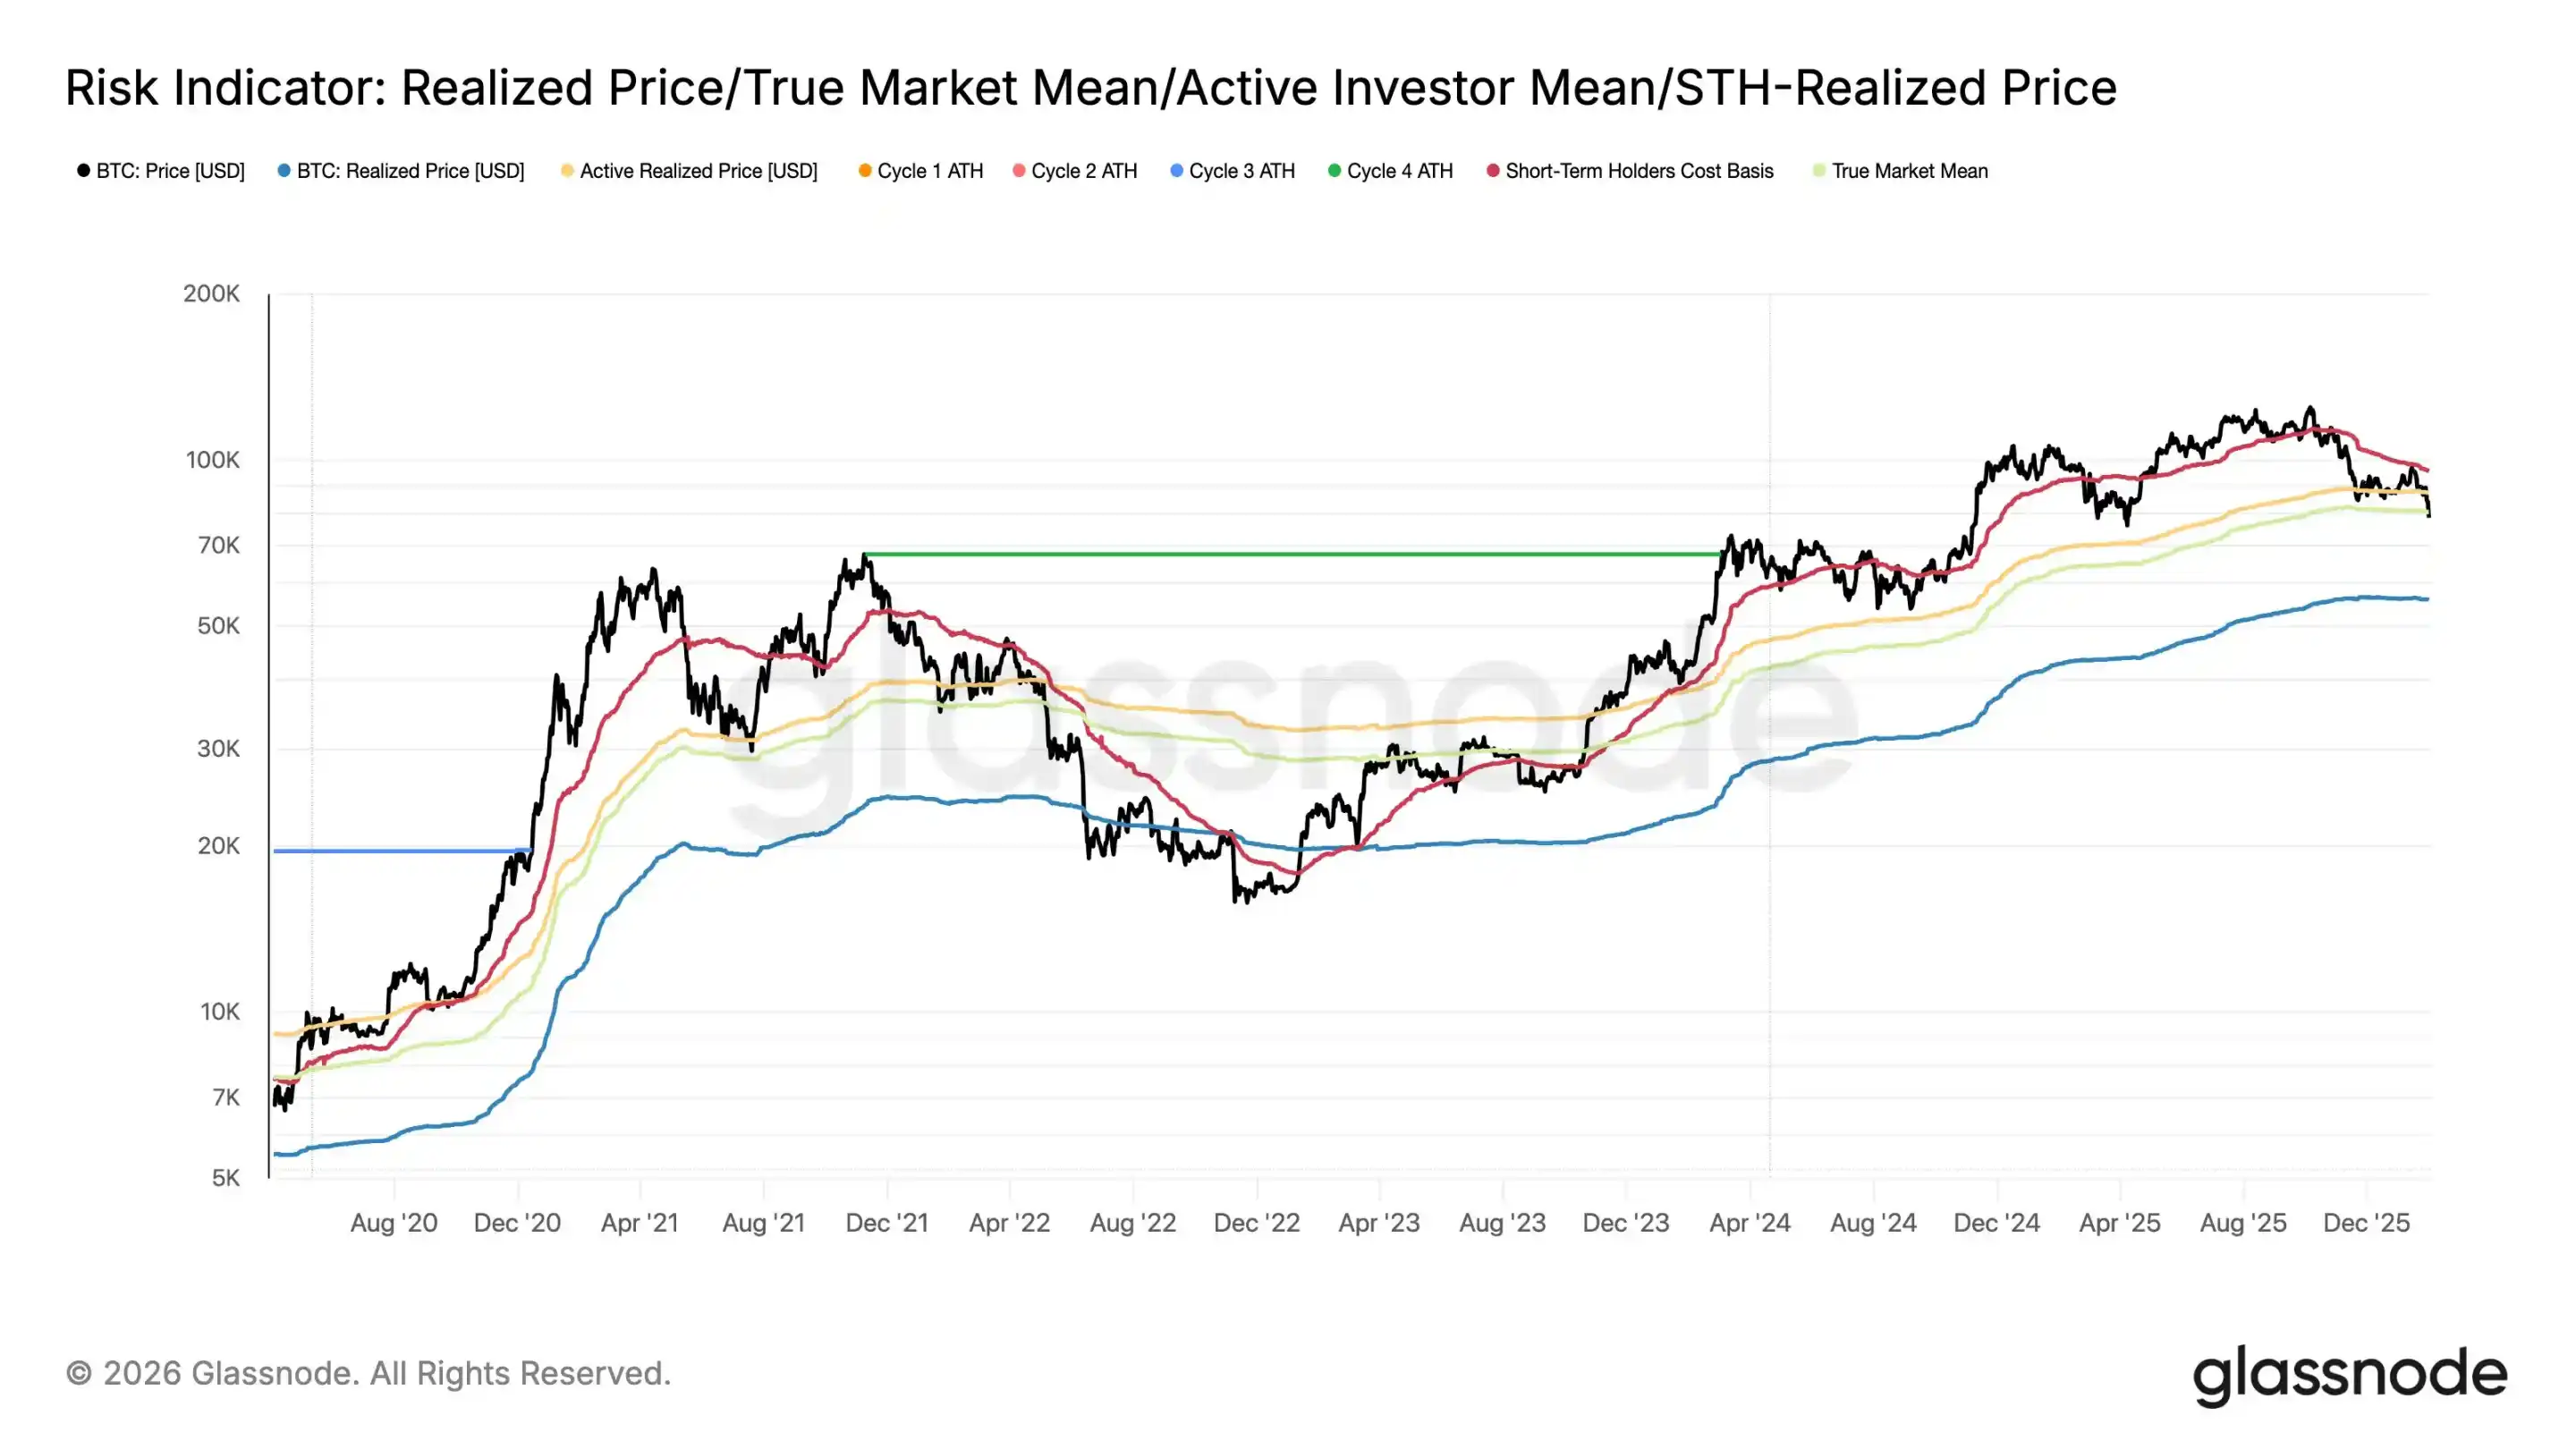
Active investor average investment, the current average holding cost of truly "on-chain" traders is $87.3k; the realized market value, focusing on the cost of actual traders in the secondary market, is $80.5k. The realized price, representing the average cost basis of all coins in the entire network, is $55.9k.
Thus, when the BTC price is below $80.5k, the price at which you bought is lower than the recent entry price of other traders. If BTC drops below $55.9k, it means your purchase price is lower than the network's average cost.
In the 2022 cycle bear market, the BTC price once fell below the entire network's average cost basis. In this cycle, whether BTC will drop below $55.9k due to factors such as macro liquidity, spot ETF, etc., remains unknown.
Ahr999 Metric Shows Coin Hoarding Signal
The ahr999 metric, invented by Weibo user ahr999 years ago, is used to assess the short-term return of BTC and price deviation. The formula for this metric is (current price / 200-day DCA cost) × (current price / exponential growth valuation), where the exponential growth valuation is based on a fitting curve of historical prices and block height, representing long-term "fair value." Historical experience shows: ahr999 < 0.45 is a low-price buy zone; 0.45-1.2 is suitable for periodic investment; >1.2 is a high-price zone.
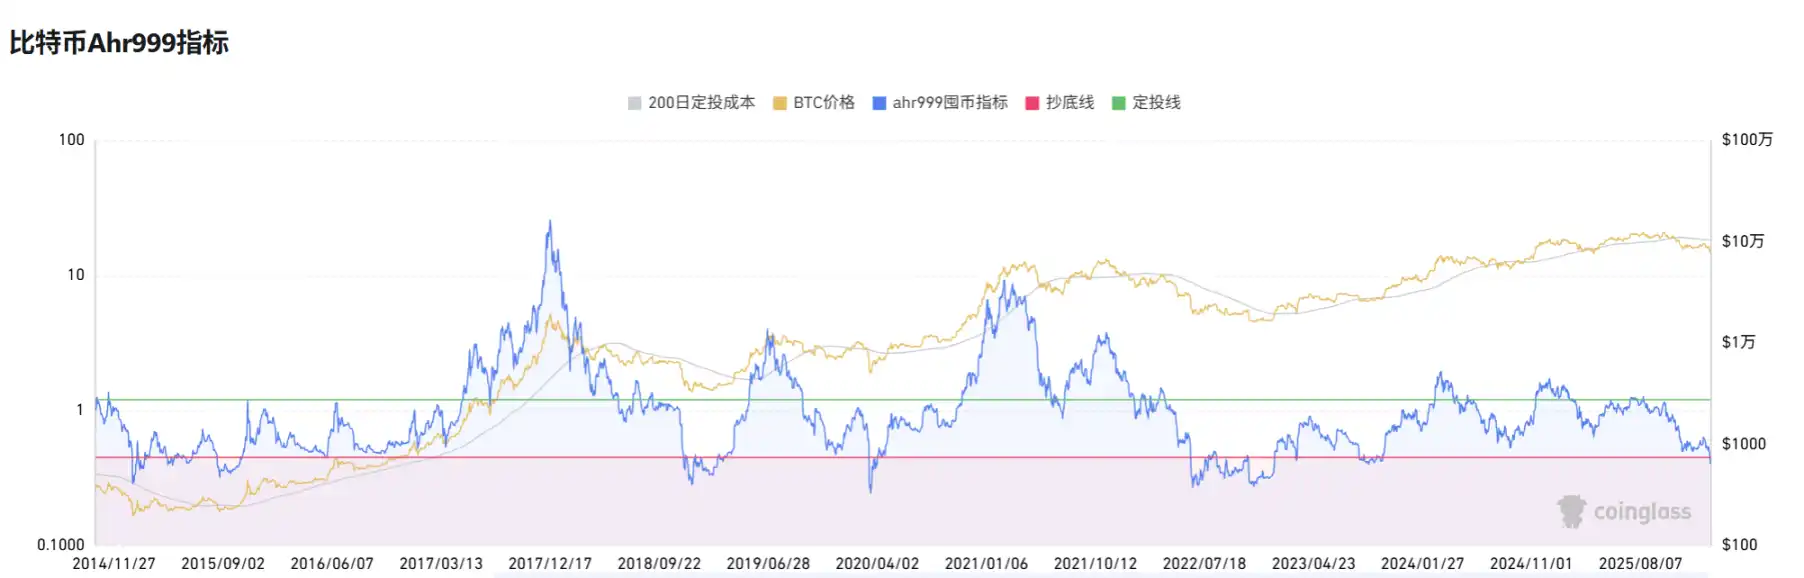
On February 1, 2026, ahr999 first dropped below 0.45, which is the first time in 839 days since October 16, 2023, signaling a potential market bottom. Breaking below this threshold currently implies that the BTC price is significantly below the long-term growth expectation, similar to the late 2023 bear market. This signal strongly suggests buying the dip but requires confirmation of a rebound with volume to avoid a false breakout. Buying the dip strategy: If ahr999 remains stable below 0.45, buying in batches below $76k, and reducing positions when the target rebounds above 1.2.
Willy Woo Metric Indicates BTC Price Floor at $45,000
Renowned analyst Willy Woo's developed metric is the CVDD model. When Bitcoin moves from an old investor who bought at $1 to a new investor who bought at $100,000, the new investor will evaluate the value of these bitcoins at a higher floor price, helping to increase the globally recognized price floor of the entire Bitcoin supply. Active custody rotation (i.e., frequent transfers of Bitcoin between different investors or custodians) may also indicate that investors highly value these bitcoins."
When many whales transfer BTC to new Bitcoin wallet addresses, the market's bottom price rises.
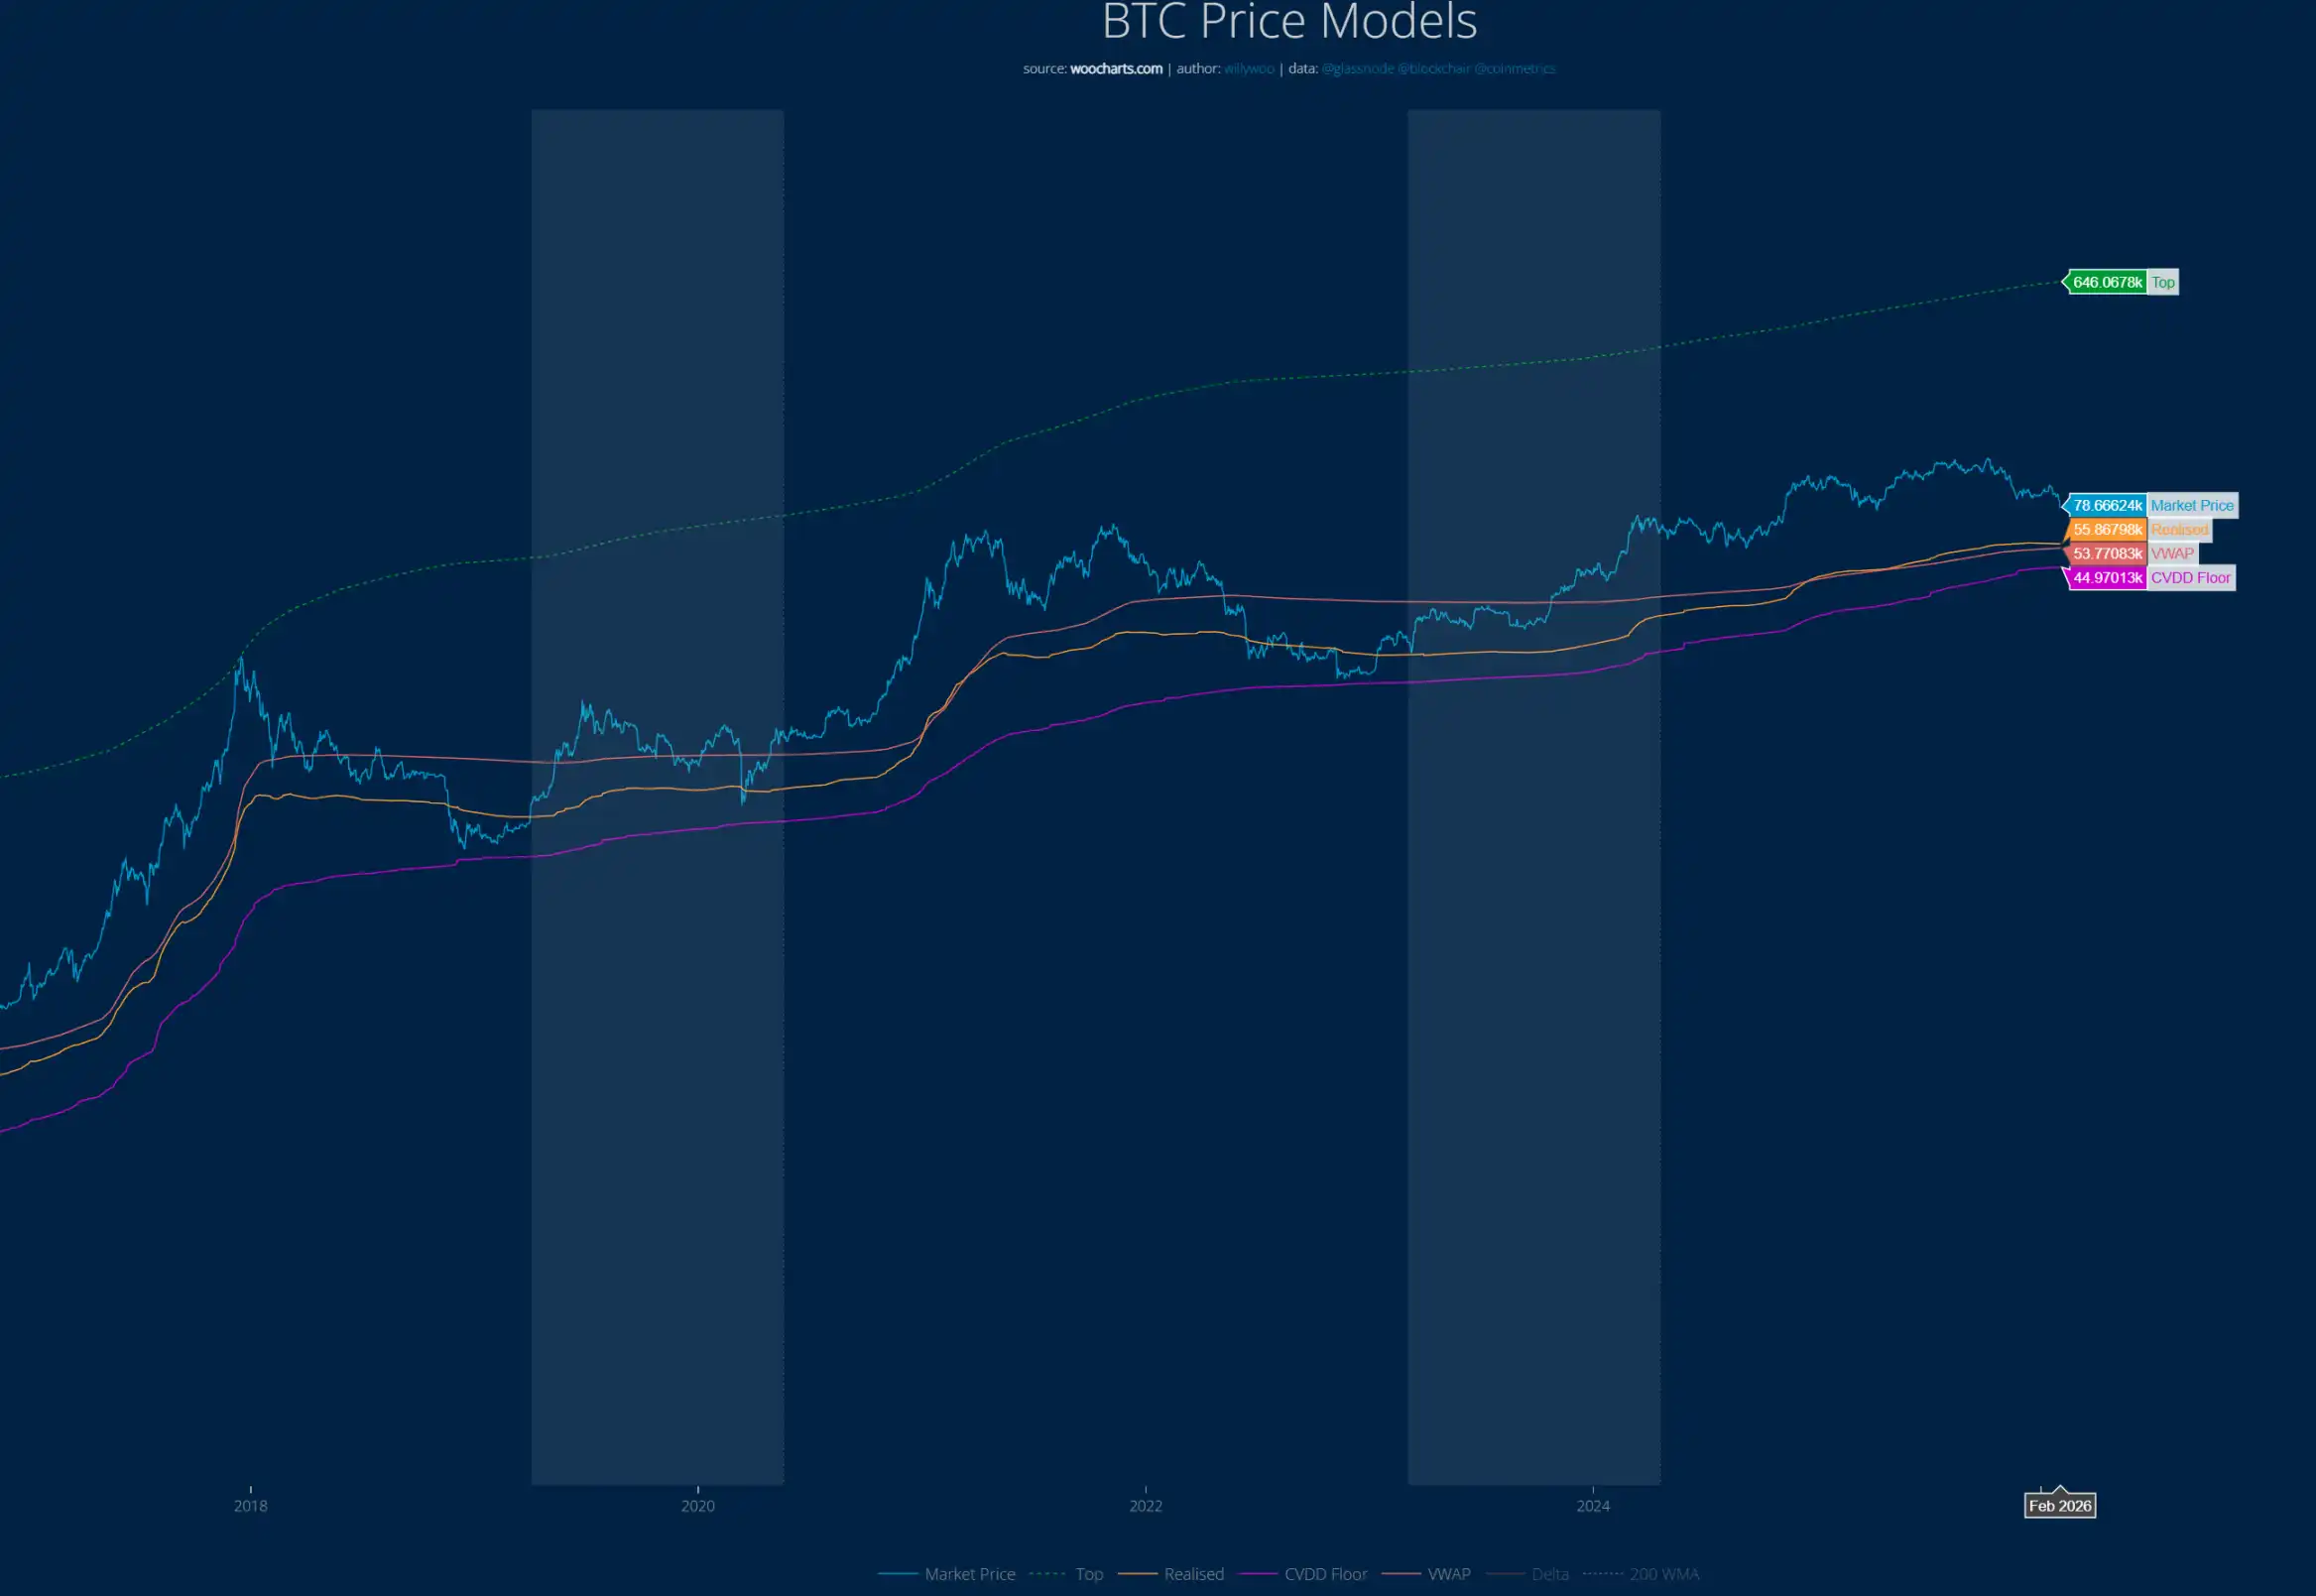
The BTC price has never dropped to the red line (CVDD model). Currently, the CVDD metric indicates a price floor of around $45,000. In past cycles, BTC once fell below the yellow line in the chart, with the current range being $53,000 to $56,000.
Strategy's Bitcoin Cost Basis $76,000
As of February 2, the well-known Bitcoin hodler Strategy's total holdings were approximately $54.2 billion, holding 712,647 BTC, with an average cost basis of around $76,040.
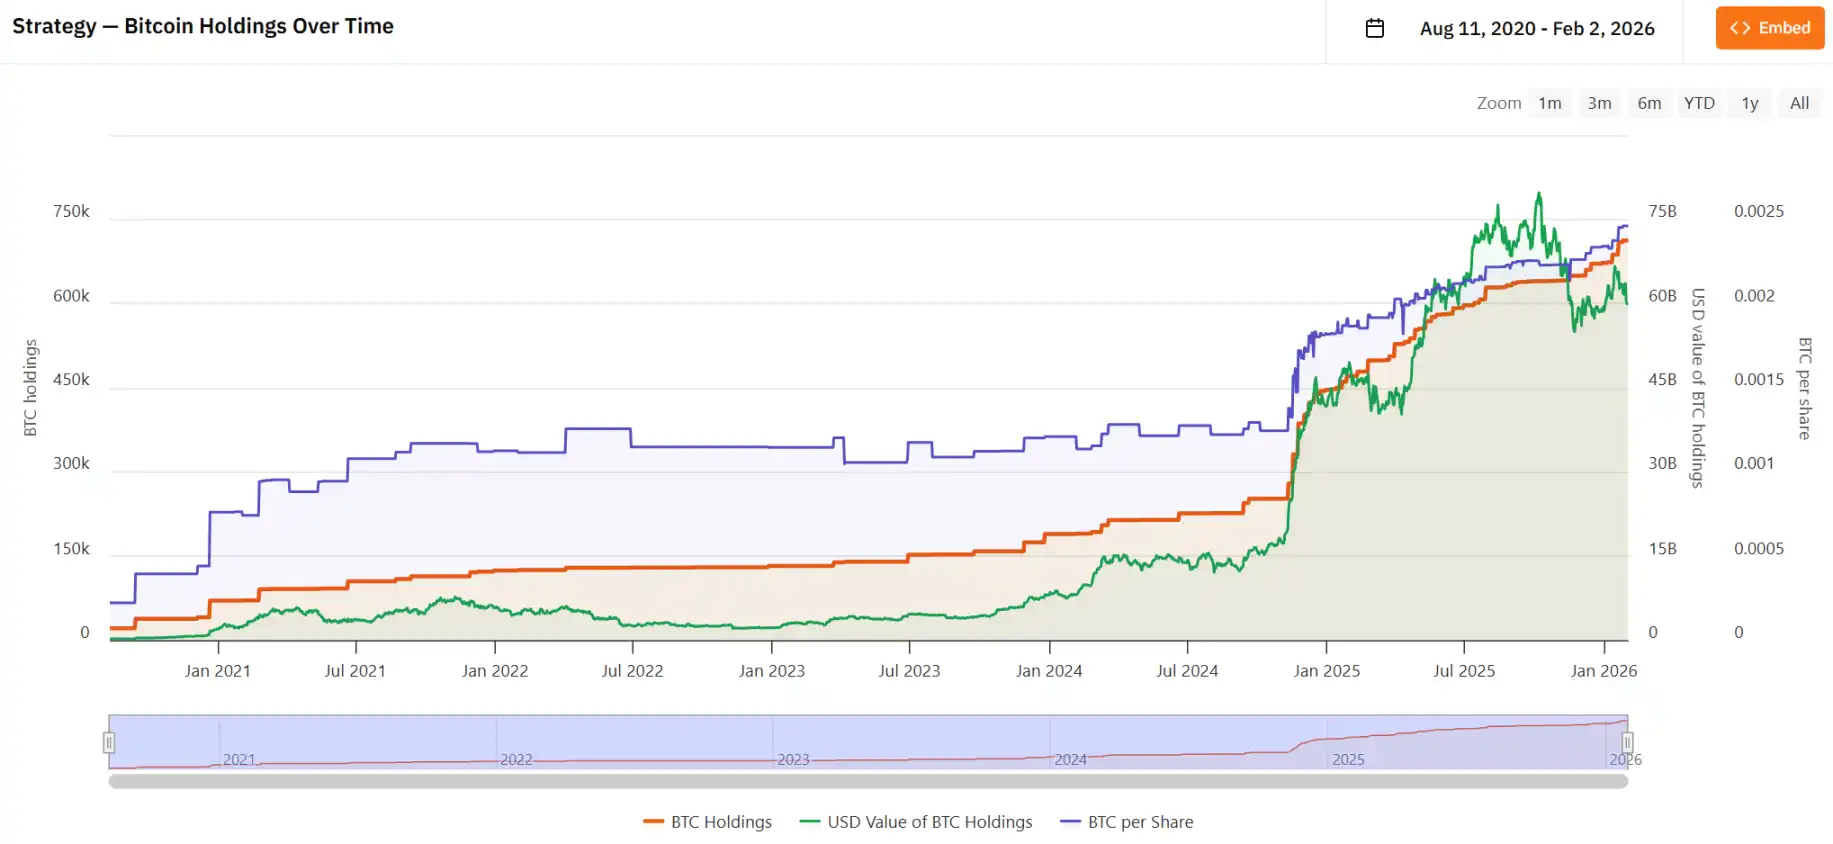
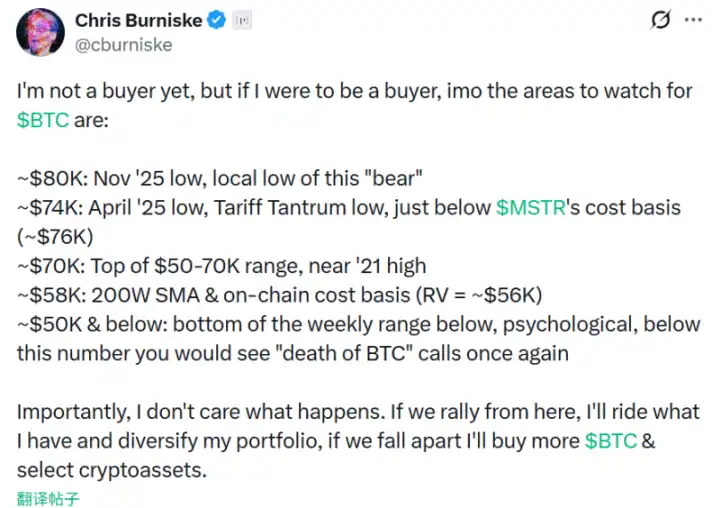
Historically, its average cost basis is considered the bottom range. Placeholder Partner Chris previously stated that the $74,000 to $76,000 range is a very significant price level to watch.
You may also like

Ten Thousand Words Interpretation of STRC: Strategy for Making Money to Buy Coins New Magic

What competitive advantages are still defensible in the AI era?

For Whom the Bell Tolls, For Whom the Lobster Feeds? A Dark Forest Survival Guide for the 2026 Agent Player

Circle CEO's Latest Interview: Stablecoins Are Not Cryptocurrency

Deconstructing the Public Chain Pharos Capital Game: Is a $950 million valuation supported by assets like photovoltaics just a shell transaction under layers of betting?

a16z: AI is making everyone 10x more productive, but the true winner has yet to emerge
Why did the star Web3 project Across Protocol choose to abandon DAO?
In fact, ETH scaling is a major benefit for L2

Memories: 10 Key Contributions of the TON Core Team That Few People Knew in the Early Days

2025 South Korea CEX Listing Post-Mortem: Investing in New Coins = 70% Loss?

BIP-360 Analysis: Bitcoin's First Step Towards Quantum Immunity, But Why Only the "First Step"?

50 million USDT exchanged for 35,000 USD AAVE: How did the disaster happen? Who should we blame?

The Cryptographic Past of the Middle East

Resolving the Intergenerational Prisoner's Dilemma: The Inevitable Path of Nomadic Capital Bitcoin

Who Will Control AI? Why Decentralized AI May Be the Only Alternative to Government and Big Tech
AI has become critical infrastructure, and governments and corporations are competing to control it. Centralized development and regulation are entrenching existing power structures. The Web3 community is building a decentralized alternative — distributed compute, token incentives, and community governance — before that window closes.

Vitalik wrote a proposal teaching you how to secretly use AI large models

On the eve of the explosion of on-chain options
WEEX AI Hackathon: How Did This AI Trading Winner Succeed?
A self-taught AI trading enthusiast achieved top-10 results at the WEEX AI Hackathon. Learn about the mindset, AI tools, and lessons behind this impressive performance.